If you don’t already have a water meter, ask your water company to fit one. This is free and typically reduces your bills by around £100 p.a. This is because those without a meter are assumed to be very high water users, and so the rates are set accordingly.
Once you have had a meter installed (or you’ve found the one you already have, which will probably be near the stopcock for the house) the simplest way to see your water consumption is to look at your water bills.
This will tell you what period the water consumption was measured over and give your water consumption in m3. You can then calculate the water consumption per person per day. Note that a cubic meter is 1000 litres.
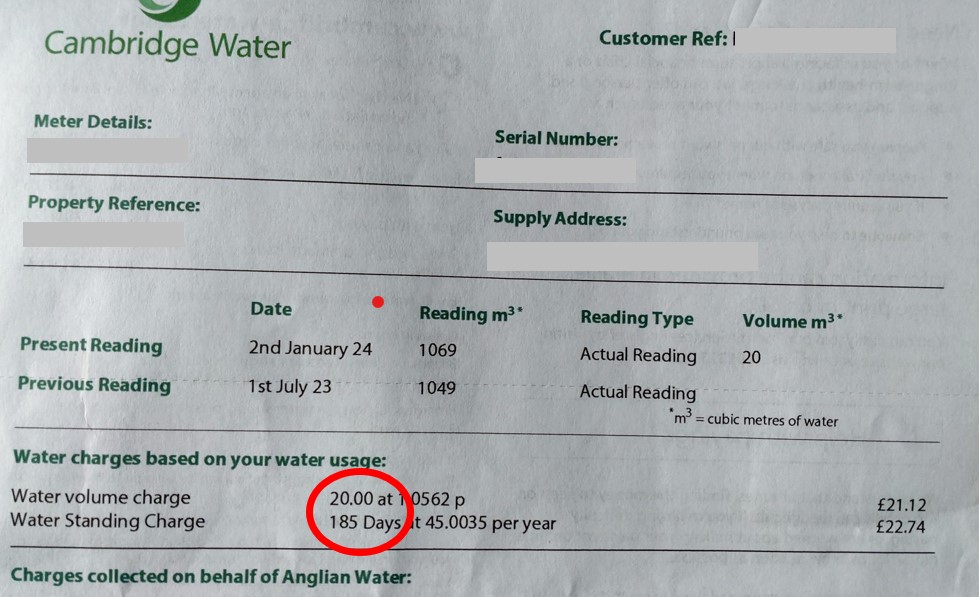
In the example given, the water consumption of the household is 20m3 x 1000 /185 days = 108 litres per day. As there are 2 people in the household, this is 54 litres per person per day.
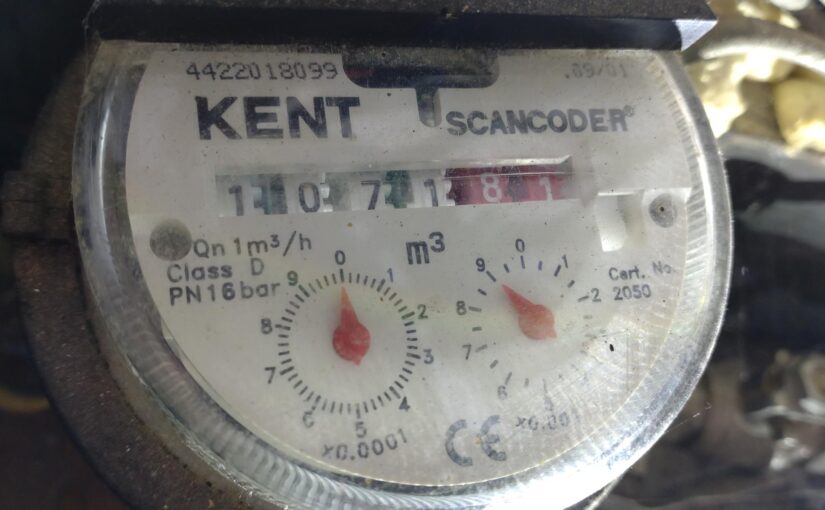
If you want more detail, you can read the meter. It will probably look something like this:
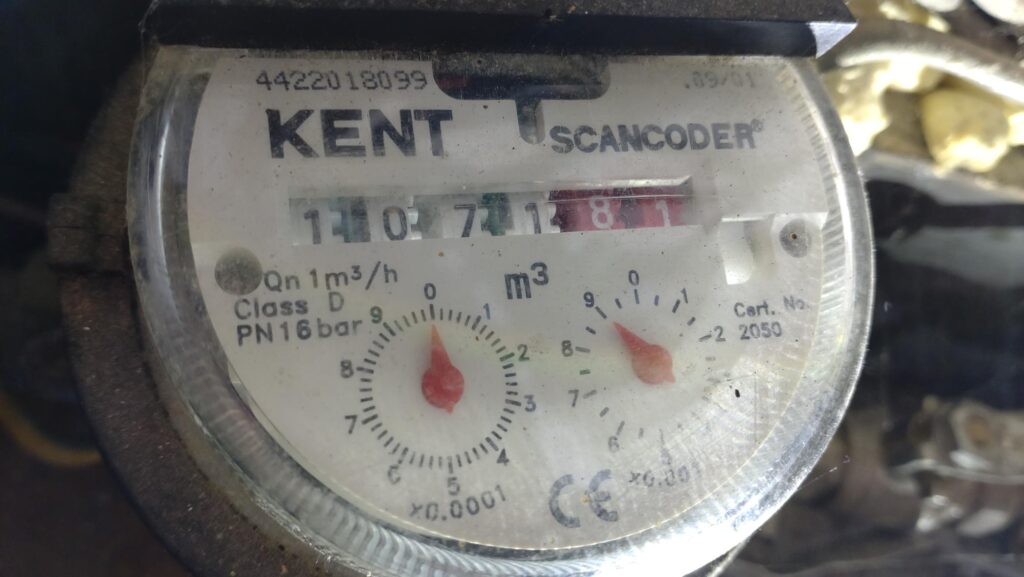
This is showing a reading of 1071.81 m3 (look at the digits and ignore the dials) If you read the meter regularly and note the dates, you will then be able to plot a graph to see how your water consumption varies during the year.
Here’s an example from one of our members.
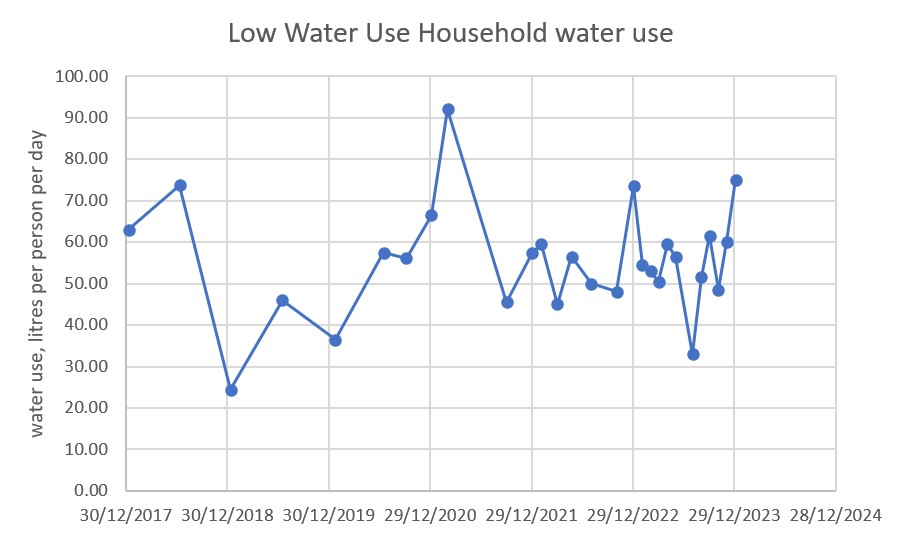
They point out that their water use increased during the Covid-19 pandemic (as it did for many) and that it can rise over the Christmas period, when family members come to stay. Nevertheless, their water use has never exceeded 100 litres per person per day and is generally around 50-60 litres per person per day. This is around 1/3rd of the average use, so they feel good that they’re helping save our Chalk streams.
To explore how people are reducing their water use, read our short article