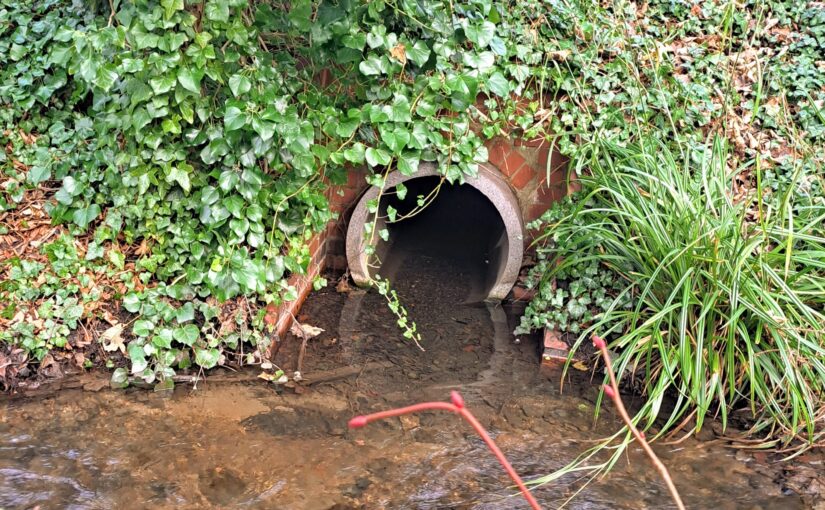
Cam Valley Forum hunts down a source of pollution in Vicars Brook
You’ve probably heard of Hobson’s Brook, the famous chalk stream which becomes Hobson’s Conduit as it approaches Cambridge towards the Botanic Gardens. However, fewer people know about its offshoot sibling, Vicar’s Brook. It’s a charming little crystal-clear chalk stream that is supplied by water from Hobson’s Brook at two places.
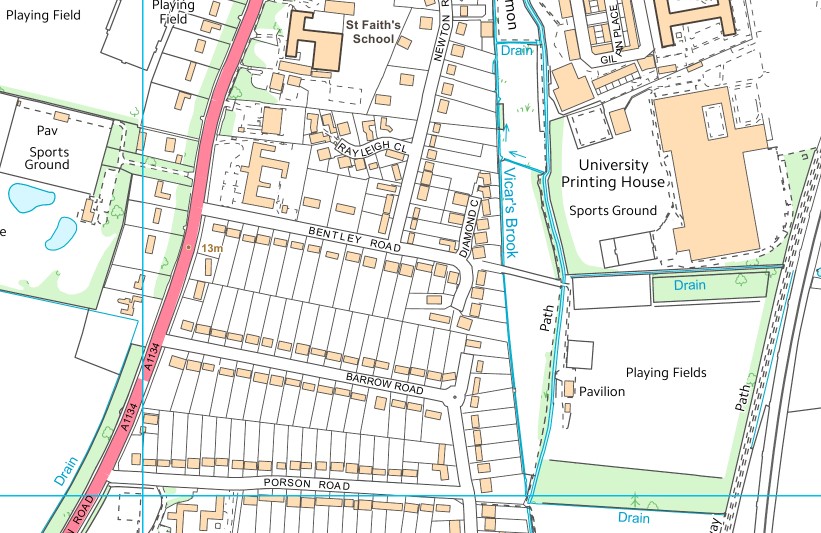
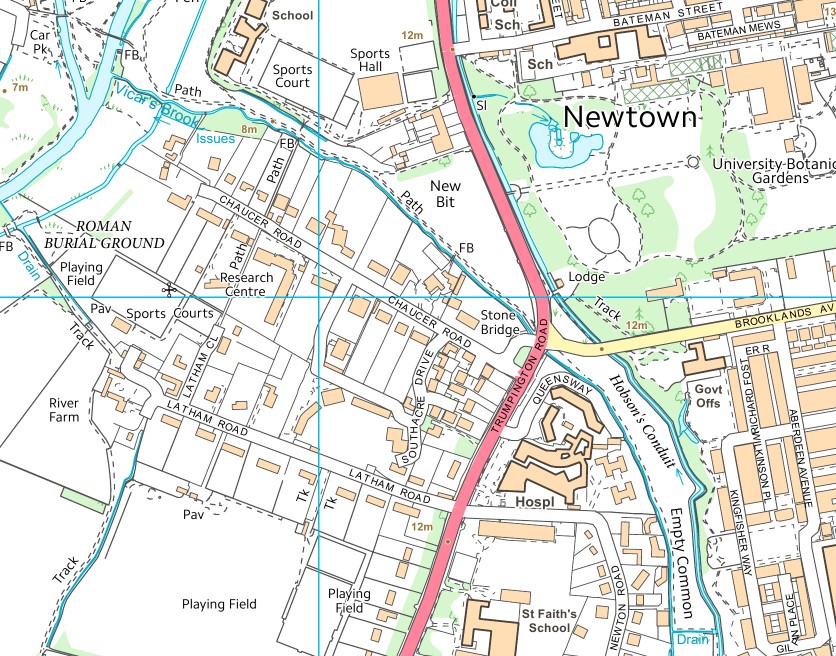
It runs alongside Empty Common allotments, through a long tunnel under the Trumpington Road/Brooklands Avenue crossroads, and continues along the side the Coe Fen cycle path, before emptying into the River Cam at Hodson’s Folly.
Shoals of silvery dace and roach, a hundred strong, can be seen dancing under the water surface.
But water clarity can deceive; invertebrate abundance and variety are not good.
Every few weeks, since May 2023, we have been sampling the brook at seven locations in the search for pollutants which could be responsible for the low invertebrate counts. There are numerous outfalls, several of them more than a foot wide, feeding into the brook. Could any be polluting this beautiful stream and affecting its aquatic life? Samples are collected at regular intervals, or when a weather event occurs which may affect the flow of the stream and the outfalls which feed it. These are analysed back at the CVF laboratory (a re-purposed dining room table in a house in Cambridge) for phosphate and E. coli.
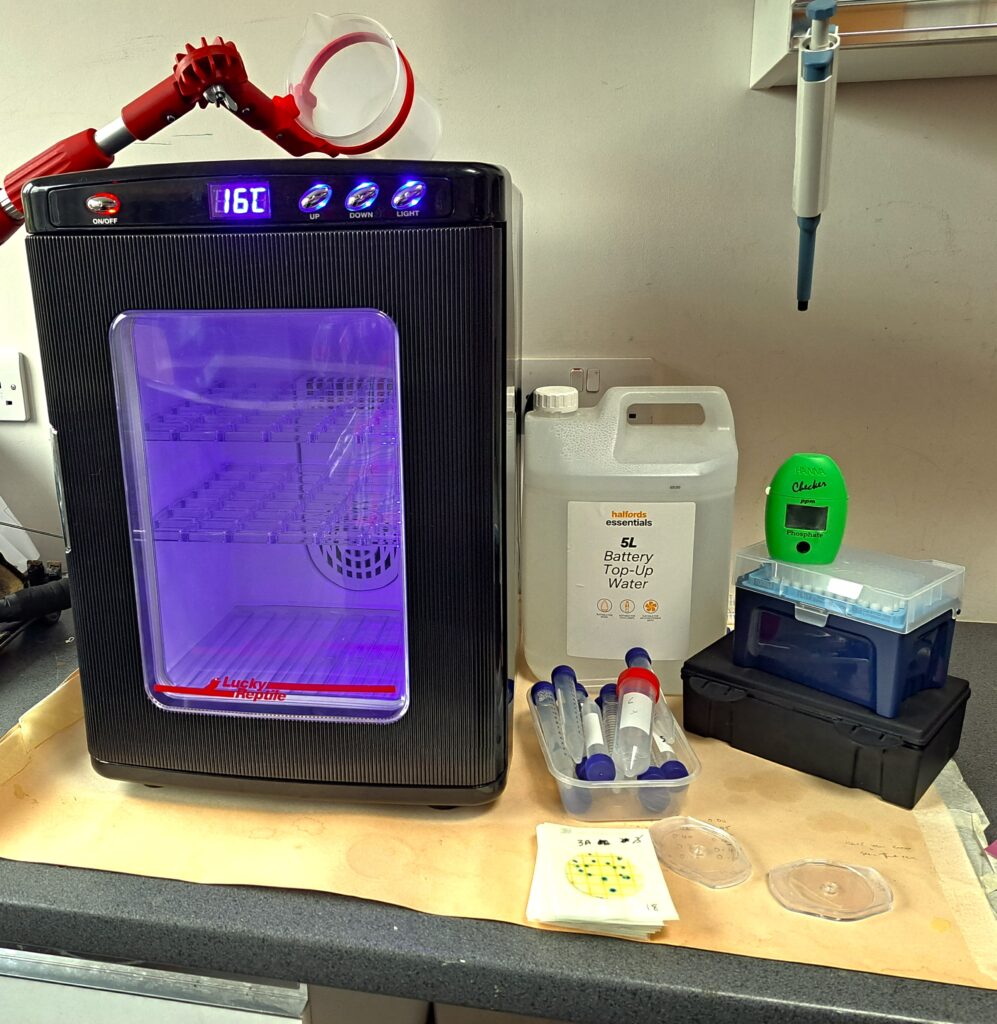
Phosphate concentration is a key indicator of chalk stream health; high levels cause the stones and gravel to become coated by ugly filamentous algae. Sources include detergents (such as car shampoo), fertilizer use and sewage. A pristine chalk stream should contain no phosphate. E. coli on the other hand is an indicator of only one thing – animal poo, including human. Measuring E. coli is actually pretty simple. One millilitre of brook water is spread across the circular part of a E. coli specific petrifilm. Incubating the films overnight allows the E. coli colonies to grow and reveal themselves as blue dots. Ten blue dots on a petrifilm is equivalent to 1000 cfus/100 ml above which faecal pollution levels are considered “elevated“, potentially resulting in bathing water quality being designated as “poor”

The blue dot count on the morning of 21 November 2023, however, turned out to be a real shocker, with the samples from points 5,6 and 7 way above the limit.
On seeing the result, our CVF sampler immediately trotted back to investigate the brook between sample points 3 and 5. It didn’t take long to identify the culprit; the outfall from the Brooklands Avenue surface water sewer was producing a very milky-looking effluent. E. coli analysis of this outfall showed over 500 blue dots!
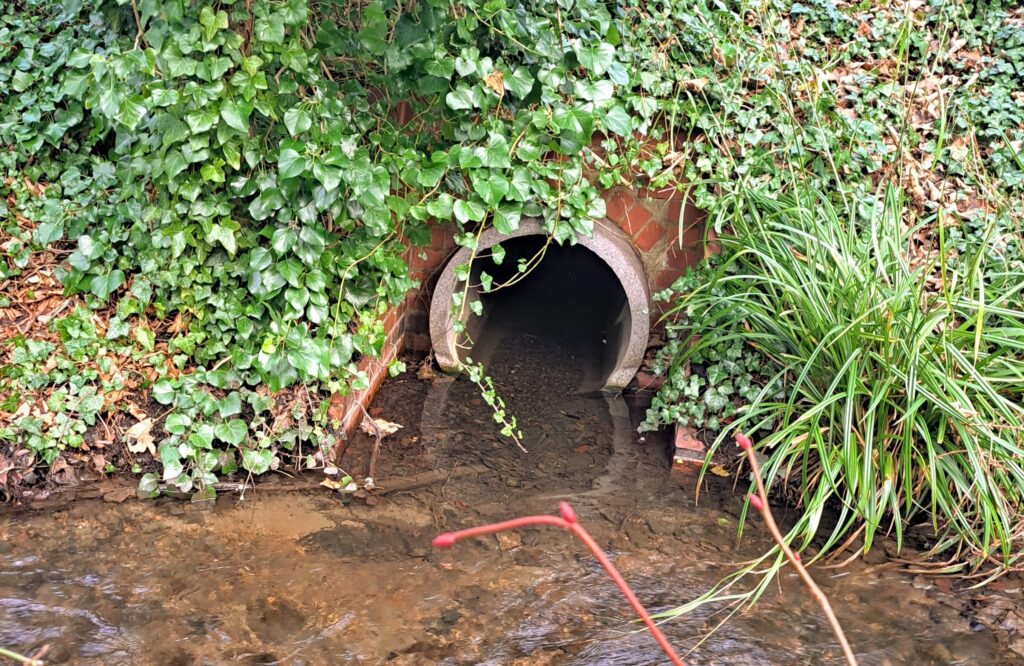
We wanted to know the source of the E. coli. Although we’d previously bought a drainage map showing the surface drains and sewers in the area, the source of the pollution wasn’t clear. The best option was to report it to Anglian Water. Pleasingly, within an hour of our phone call, AW technicans had arrived at the outfall and samples were being analysed using a handheld on-the-spot ammonia meter. Ammonia is also an indicator of sewage effluent. Although the milkiness had dissipated by then, the ammonia levels were still very high, much higher than surface drain water should be.
We spent the next few hours accompanying AW staff as they lifted manholes, diligently sampling and analysing as they moved along Brooklands Avenue. The probable culprit was finally identified as a construction works along Clarendon Road (most likely a misconnected portable toilet). AW promised to resolve the source of the pollution. Several days later CVF was informed that re-sampling at the outfall had shown zero ammonia levels, indicating that action had been taken to resolve the leakage.
Do take the time to explore our lovely Vicar’s Brook, and look out for the shoals of dace and roach as you go, but do keep your eyes, and nostrils, open. It needs looking after, and citizen science really can make a difference.
To get involved, join us!

